Posts about performance (old posts, page 1)

Profiling Buildbot

Buildbot is a critical part of our build infrastructure at Mozilla. We use it to manage builds on 5 different platforms (Linux, Mac, Windows, Maemo and Windows Mobile), and 5 different branches (mozilla-1.9.1, mozilla-central, TraceMonkey, Electrolysis, and Places). All in all we have 80 machines doing builds across 150 different build types (not counting Talos; all the Talos test runs and slaves are managed by a different master). And buildbot is at the center of it all. The load on our machine running buildbot is normally fairly high, and occasionally spikes so that the buildbot process is unresponsive. It normally restores itself within a few minutes, but I'd really like to know why it's doing this! Running our staging buildbot master with python's cProfile module for almost two hours yields the following profile:
   ncalls  tottime  percall  cumtime  percall filename:lineno(function)
   416377 4771.188    0.011 4796.749    0.012 {select.select}
       52  526.891   10.133  651.043   12.520 /tools/buildbot/lib/python2.5/site-packages/buildbot-0.7.10p1-py2.5.egg/buildbot/status/web/waterfall.py:834(phase2)
     6518  355.370    0.055  355.370    0.055 {posix.fsync}
   232582  238.943    0.001 1112.039    0.005 /tools/twisted-8.0.1/lib/python2.5/site-packages/twisted/spread/banana.py:150(dataReceived)
 10089681  104.395    0.000  130.089    0.000 /tools/twisted-8.0.1/lib/python2.5/site-packages/twisted/spread/banana.py:36(b1282int)
36798140/36797962   83.536    0.000   83.537    0.000 {len}
 29913653   70.458    0.000   70.458    0.000 {method 'append' of 'list' objects}
      311   63.775    0.205   63.775    0.205 {bz2.compress}
 10088987   56.581    0.000  665.982    0.000 /tools/twisted-8.0.1/lib/python2.5/site-packages/twisted/spread/banana.py:141(gotItem)
4010792/1014652   56.079    0.000  176.693    0.000 /tools/twisted-8.0.1/lib/python2.5/site-packages/twisted/spread/jelly.py:639(unjelly)

2343910/512709   47.954    0.000  112.446    0.000 /tools/twisted-8.0.1/lib/python2.5/site-packages/twisted/spread/banana.py:281(_encode)

Interpreting the results

select shows up in the profile because we're profiling wall clock time, not cpu time. So the more time we're spending in select, the better, since that means we're just waiting for data. The overall run time for this profile was 7,532 seconds, so select is taking around 63% of our total time. I believe the more time spent here, the better. Time spent inside select is idle time. We already knew that the buildbot waterfall was slow (the second line in profile). fsync isn't too surprising either. buildbot calls fsync after writing log files to disk. We've considered removing this call, and this profile lends support to our original guess. The next entries really surprised me, twisted's dataReceived and a decoding function, b1282int. These are called when processing data received from the slaves. If I'm reading this correctly, this means that dataReceived and children account for around 40% of our total time after you remove the time spent in select. 1112 / (7532-4796) = 40%. These results are from our staging buildbot master, which doesn't have anywhere near the same load as the production buildbot master. I would expect that the time spent waiting in select would go down on the production master (there's more data being received, more often), and that time spent in fsync and dataReceived would go up.

What to do about it?

A few ideas....
  • Use psyco to get some JIT goodness applied to some of the slower python functions.
  • Remove the fsync call after saving logs.
  • Use the cpu-time to profile rather than wallclock time. This will give a different perspective on the performance of buildbot, which should give better information about where we're spending time processing data.
  • Implement slow pieces in C (or cython). Twisted's Banana library looks do-able in C, and also is high up in the profile.
  • Send less data from the slaves. We're currently logging all stdout/stderr produced by the slaves. All of this data is processed by the master process and then saved to disk.
  • Rearchitect buildbot to handle this kind of load.
  • Have more than one buildbot master, each one handling fewer slaves. We're actively looking into this approach, since it also allows us to have some redundancy for this critical piece of our infrastructure.
Pooling the Talos slaves

One of the big projects for me this quarter was getting our Talos slaves configured as a pool of machines shared across branches. The details are being tracked in bug 488367 for those interested in the details. This is a continuation of our work on pooling our slaves, like we've done over the past year with our build, unittest, and l10n slaves. Up until now each branch has had a dedicated set of Mac Minis to run performance tests for just that branch, on five different operating systems. For example, the Firefox 3.0 branch used to have 19 Mac Minis doing regular Talos tests: 4 of each platform (except for Leopard, which had 3). Across our 4 active branches (Firefox 3.0, 3.5, 3.next, and TraceMonkey), we have around 80 minis in total! That's a lot of minis! What we've been working towards is to put all the Talos slaves into one pool that is shared between all our active branches. Slaves will be given builds to test in FIFO order, regardless of which branch the build is produced on. This new pool will be....

Faster

With more slaves available to all branches, the time to wait for a free slave will go down, so testing can start more quickly...which means you get your results sooner!

Smarter

It will be able to handle varying load between branches. If there's a lot of activity on one branch, like on the Firefox 3.5 branch before a release, then more slaves will be available to test those builds and won't be sitting idle waiting for builds from low activity branches.

Scalable

We will be able to scale our infrastructure much better using a pooled system. Similar to how moving to pooled build and unittest slaves has allowed us to scale based on number of checkins rather than number of branches, having pooled Talos slaves will allow us to scale our capacity based on number of builds produced rather than the number of branches. In the current setup, each new release or project branch required an allocation of at least 15 minis to dedicate to the branch. Once all our Talos slaves are pooled, we will be able to add Talos support for new project or release branches with a few configuration changes instead of waiting for new minis to be provisioned. This means we can get up and running with new project branches much more quickly!

More Robust

We'll also be in a much better position in terms of maintenance of the machines. When a slave goes offline, the test coverage for any one branch won't be jeopardized since we'll still have the rest of the slaves that can test builds from that branch. In the current setup, if one or two machines of the same platform needs maintenance on one branch, then our performance test coverage of that branch is significantly impacted. With only one or two machines remaining to run tests on that platform, it can be difficult to determine if a performance regression is caused by a code change, or is caused by some machine issue. Losing two or three machines in this scenario is enough to close the tree, since we no longer have reliable performance data. With pooled slaves we would see a much more gradual decrease in coverage when machines go offline. It's the difference between losing one third of the machines on your branch, and losing one tenth.

When is all this going to happen?

Some of it has started already! We have a small pool of slaves testing builds from our four branches right now. If you know how to coerce Tinderbox to show you hidden columns, you can take a look for yourself. They're also reporting to the new graph server using machines names starting with 'talos-rev2'. We have some new minis waiting to be added to the pool. Together with existing slaves, this will give us around 25 machines in total to start off the new pool. This isn't enough yet to be able to test every build from each branch without skipping any, so for the moment the pool will be skipping to the most recent build per branch if there's any backlog. It's worth pointing out that our current Talos system also skips builds if there's any backlog. However, our goal is to turn off skipping once we have enough slaves in the pool to handle our peak loads comfortably. After this initial batch is up and running, we'll be waiting for a suitable time to start moving the existing Talos slaves into the pool. All in all, this should be a big win for everyone!

Parallelizing Unit Tests

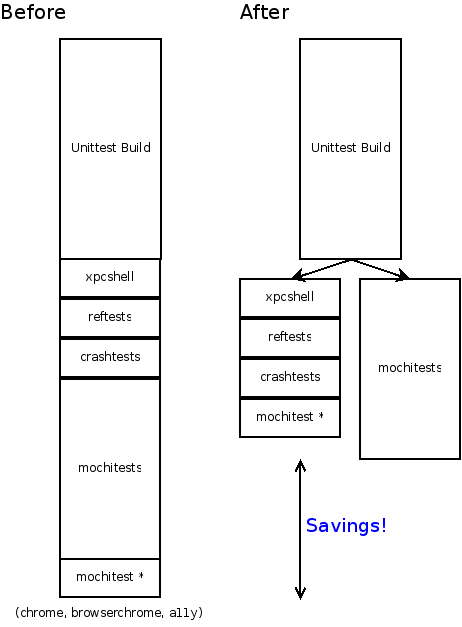
Last week we flipped the switch and turned on running unit tests on packaged builds for our mozilla-1.9.1, mozilla-central, and tracemonkey branches. What this means is that our current unit test builds are uploaded to a web server along with all their unit tests. Another machine will then download the build and tests, and run various test suites on them. Splitting up the tests this way allows us to run the test suites in parallel, so the mochitest suite will run on one machine, and all the other suites will be run on another machine (this group of tests is creatively named 'everythingelse' on Tinderbox). paralleltests Splitting up the tests is a critical step towards reducing our end-to-end time, which is the total time elapsed between when a change is pushed into one of the source repositories, and when all of the results from that build are available. Up until now, you had to wait for all the test suites to be completed in sequence, which could take over an hour in total. Now that we can split the tests up, the wait time is determined by the longest test suite. The mochitest suite is currently the biggest chunk here, taking somewhere around 35 minutes to complete, and all of the other tests combined take around 20 minutes. One of the next steps for us to do is to look at splitting up the mochitests into smaller pieces. For the time being, we will continue to run the existing unit tests on the same machine that is creating the build. This is so that we can make sure that running tests on the packaged builds is giving us the same results (there are already some known differences: bug 491675, bug 475383) Parallelizing the unit tests, and the infrastructure required to run them, is the first step towards achieving a few important goals. - Reducing end-to-end time. - Running unit tests on debug, as well as on optimized builds. Once we've got both of these going, we can turn off the builds that are currently done solely to be able to run tests on them. - Running unit tests on the same build multiple times, to help isolate intermittent test failures. All of the gory details can be found in bug 383136.

Automated Talos Analysis

As part of one of our goals in Release Engineering this quarter, I'm investigating whether we can automatically detect variance in Talos performance data. Automatically detecting these changes in performance results would be a great help to developers and tree sheriffs. Imagine if the Tinderbox tree could be made to burn if a performance regression was detected? There are lots of possibilities if we can get this working: regressions could cause the tree to burn, firebot could spam #developers with information, try-talos data could be compared more easily to the baseline data, or we could automatically back out changes that cause regressions! :P This is also exciting, because it allows us to consider moving towards a pool-o'-slaves model for the Talos machines, just like we have for build and unittests right now. Having Talos use a pool-o'-slaves allows us to scale to additional project / release branches much more quickly, and allows us to be more flexible in allocating machines across branches. I've spent some time over the past few weeks playing around with data from graph server, bugging Johnathan, and having fun with flot, and I think I've come up with a workable solution.

How it works

I grab all the data for a test/branch/platform combination, and merge it into a single data series, ordered by buildid (the closest thing we've got right now to being able to sort the data in the same order in which changes landed). Individual data points are classified into one of four buckets:
  • "Good" data. We think these data points are within a certain tolerance of the expected value. Determining what the expected value is a bit tricky, so read on!
  • "Spikes". These data points are outside of the specified tolerance, but don't seem to be part of an ongoing problem (yet). Spikes can be caused by having the tolerance set too low, random machine voodoo, or not having enough data to make a definitive call as to if it's a code regression or machine problem.
  • "Regressions". When 3 or more data points are outside of the tolerance in the same direction, we assume this is due to a problem with the code, and flag it as a regression.
  • "Machine problem". When the last 2 data points from the same machine have been outside of the tolerance, then we assume this is due to a problem with the machine.
For the purposes of the algorithm (and this post!), a regression is a deviation from the expected value, regardless of it's a performance gain or loss. At this point the tolerance criteria is being set semi-manually. For each test/branch/platform combination, the tolerance is set as a certain number of standard deviations. The expected value is then determined by going back in the performance data history and looking for a certain sized window of data where no point is more than the configured number of standard deviations from the average. This can change over time, so we re-calculate the expected value at each point in the graph.

Initial Results

As an example, here's how data from Linux Tp3 tests on the Mozilla 1.9.2 branch is categorized: Linux Tp3 Data for Mozilla 1.9.2 Or, if you have a canvas-enabled browser, check out this interactive graph. A window size of 20 and a standard deviation threshold of 2.5 was used here for this data set. The green line represents all the good data. The orange line (which is mostly hidden by the green line), represents the raw data from the 3 Linux machines running that test. The orange circles represent spikes in the data, red circles represent regressions, and blue circles represent possible machine problems. For the most part we can ignore the spikes. Too many spikes probably means we need to tighten our tolerance a bit There are two periods of to take notice of on this graph:
  • Jan 12, around noon, a regression was detected. Two orange spike circles are followed by three red regression circles. Recall that we wait for the 3rd data point to confirm an actual regression.
  • Jan 30, around noon, a similar case. Two orange spike circles, followed by regression points.
Although in these cases, the regression was actually a win in terms of performance, it shows that the algorithm works. The second regression is due to Alice unthrottling the Talos boxes. In both cases, a new expected value is found after the data levels off again. The analysis also produces some textual output more suitable for e-mail, nagios or irc notification, e.g.: Regression: Tp3 decrease from 417.974 to 235.778 (43.59%) on Fri Jan 30 11:34:00 2009. Linux 1.9.2 build 20090130083434 http://graphs.mozilla.org/#show=395125,395135,395166&sel=1233236074,1233408874 http://hg.mozilla.org/mozilla-central/pushloghtml?fromchange=7f5292b5b9e2&tochange=f1493cf102b9 My code can be found on http://hg.mozilla.org/users/catlee_mozilla.com/talos-grokker. Patches or comments welcome!