Posts about python (old posts, page 3)

3 days of fun: a journey into the bowels of buildbot

I've just spent 3 days trying to debug some new code in buildbot. The code in question is to implement a change to how we do nightly builds such that they use the same revision for all platforms. I was hitting a KeyError exception inside buildbot's util.loop code, specifically at a line where it is trying to delete a key from a dictionary. In simple form, the loop is doing this:


for k in d.keys():
    if condition:
        del d[k] # Raises KeyError....sometimes...
Tricky bit was, it didn't happen every time. I'd have to wait at least 3 minutes between attempts. So I added a bunch of debugging code:

print d

print d.keys()

for k in d.keys():
    print k
    if condition:
        try:
            del d[k] # Raises KeyError....sometimes...
        except KeyError:
            print k in d # sanity check 1
            print k in d.keys() # sanity check 2
Can you guess what the results of sanity checks 1 and 2 were? 'k in d' is False, but 'k in d.keys()' is True. whhhaaaaa? Much head scratching and hair pulling ensued. I tried many different variations of iterating through the loop, all with the same result. In the end, I posted a question on Stack Overflow. At the same time, Bear and Dustin were zeroing in on a solution. The crucial bit here is that the keys of d are (follow me here...) methods of instances of my new scheduler classes, which inherit from buildbot.util.ComparableMixin...which implements __cmp__ and __hash__. __cmp__ is used in the 'k in d.keys()' test, but __hash__ is used in the 'k in d' test. Some further digging revealed that my scheduler was modifying state that ComparableMixin.__hash__ was referring to, resulting in the scheduler instances not having stable hashes over time. Meanwhile, on stackoverflow, adw came up with an answer that confirmed what Dustin and Bear were saying, and katrielalex came up with a simple example to reproduce the problem. In the end, the fix was simple, just a few extra lines of python code. Too bad it took me 3 days to figure out!
poster 0.7.0 released!

I've just pushed poster 0.7.0 to the cheeseshop. Thanks again to everybody who sent in bug reports, and for letting me know how you're using poster! It's really great to hear from users. poster 0.7.0 fixes a few problems with 0.6.0, most notably:

  • Added callback parameters to MutipartParam and multipart_encode so you can add progress indicators to your applications. Thanks to Ludvig Ericson for the suggestion.
  • Fixed a bug where posting to a url that returned a 401 code would hang. Thanks to Patrick Guido and Andreas Loupasakis for the bug reports.
  • MultipartParam.from_params will now accept MultipartParam instances as the values of a dict object passed in. The parameter name must match the key corresponding to the parameter in the dict. Thanks to Matthew King for the suggestion.
  • poster now works under python2.7
poster 0.7.0 can be downloaded from the cheeseshop, or from my website. Documentation can be found at https://atlee.ca/software/poster/ I'm planning on looking at python 3 compatibility soon. Also, if anybody has suggestions on a reliable way to test the streaming http code, I'm open to suggestions! My current methods result in intermittent failures because of the test harness I suspect. poster's code is now available on bitbucket.

A year in RelEng

Something prompted me to look at the size of our codebase here in RelEng, and how much it changes over time. This is the code that drives all the build, test and release automation for Firefox, project branches, and Try, as well as configuration management for the various build and test machines that we have. Here are some simple stats: 2,193 changesets across 5 repositories...that's about 6 changes a day on average. We grew from 43,294 lines of code last year to 73,549 lines of code as of today. That's 70% more code today than we had last year. We added 88,154 lines to our code base, and removed 51,957. I'm not sure what this means, but it seems like a pretty high rate of change!

Getting free diskspace in python, on Windows

Amazingly, one of the most popular links on this site is the quick tip, Getting free diskspace in python. One of the comments shows that this method doesn't work on Windows. Here's a version that does:

import win32file

def freespace(p):
    """
    Returns the number of free bytes on the drive that ``p`` is on
    """
    secsPerClus, bytesPerSec, nFreeClus, totClus = win32file.GetDiskFreeSpace(p)
    return secsPerClus * bytesPerSec * nFreeClus
The win32file module is part of the pywin32 extension module.

poster 0.6.0 released

I've just pushed poster 0.6.0 to the cheeseshop. Thanks again to everybody who sent in bug reports, and for letting me know how you're using poster! It's really great to hear from users. poster 0.6.0 fixes a few problems with 0.5, most notably:

  • Documentation updates to clarify some common use cases.
  • Added a poster.version attribute. Thanks to JP!
  • Fix for unicode filenames. Thanks to Zed Shaw.
  • Handle StringIO file objects. Thanks to Christophe Combelles.
poster 0.6.0 can be downloaded from the cheeseshop, or from my website. Documentation can be found at https://atlee.ca/software/poster/

What do you want to know about builds?

Mozilla has been quite involved in recent buildbot development, in particular, helping to make it scale across multiple machines. More on this in another post! Once deployed, these changes will give us the ability to give real time access to various information about our build queue: the list of jobs waiting to start, and which jobs are in progress. This should help other tools like Tinderboxpushlog show more accurate information. One limitation of the upstream work so far is that it only captures a very coarse level of detail about builds: start/end time, and result code is pretty much it. No further detail about the build is captured, like which slave it executed on, what properties it generated (which could include useful information like the URL to the generated binaries), etc. We've also been exporting a json dump of our build status for many months now. It's been useful for some analysis, but it also has limitations: the data is always at least 5 minutes old by the time you look, and in-progress builds are not represented at all. We're starting to look at ways of exporting all this detail in a way that's useful to more people. You want to get notified when your try builds are done? You want to look at which test suites are taking the most time? You want to determine how our build times change over time? You want to find out what the last all-green revision was on trunk? We want to make this data available, so anybody can write these tools.

Just how big is that firehose?

I think we have one of the largest buildbot setups out there and we generate a non-trivial amount of data:
  • 6-10 buildbot master processes generating updates, on different machines in 2 or 3 data centers
  • around 130 jobs per hour composed of 4,773 individual steps total per hour. That works out to about 1.4 updates per second that are generated

How you can help

This is where you come in. I can think of two main classes of interfaces we could set up: a query-type interface where you poll for information that you are interested in, and a notification system where you register a listener for certain types (or all!) events. What would be the best way for us to make this data available to you? Some kind of REST API? A message or event brokering system? pubsubhubbub? Is there some type of data or filtering that would be super helpful to you?

Buildbot performance and scaling

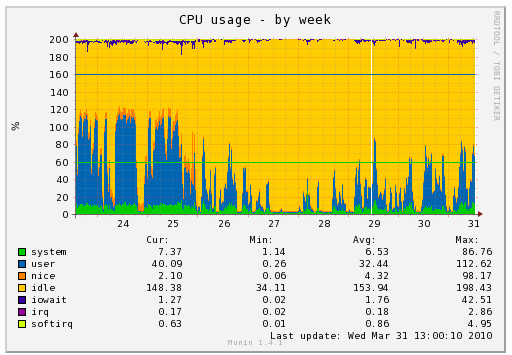
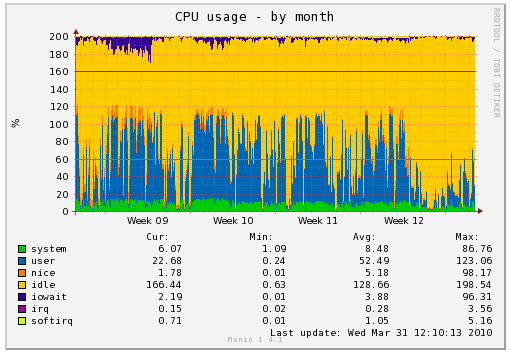
It seems like it was ages ago when I posted about profiling buildbot. One of the hot spots identified there was the dataReceived call. This has been sped up a little bit in recent versions of twisted, but our buildbot masters were still severely overloaded. It turns out that the buildbot slaves make a lot of RPC calls when sending log data, which results in tens of thousands of dataReceived calls. Multiply that by several dozen build slaves sending log data peaking at a combined throughput of 10 megabits/s and you've got an awful lot of data to handle. By adding a small slave-side buffer, the number of RPC calls to send log data is drastically reduced by an order of magnitude in some tests, resulting in a much better load situation on the master. This is good for us, because it means the masters are much more responsive, and it's good for everybody else because it means we have fewer failures and wasted time due to the master being too busy to handle everything. It also means we can throw more build slaves onto the masters! The new code was deployed towards the end of the day on the 26th, or the end of the 12th week.

Profiling Buildbot

Buildbot is a critical part of our build infrastructure at Mozilla. We use it to manage builds on 5 different platforms (Linux, Mac, Windows, Maemo and Windows Mobile), and 5 different branches (mozilla-1.9.1, mozilla-central, TraceMonkey, Electrolysis, and Places). All in all we have 80 machines doing builds across 150 different build types (not counting Talos; all the Talos test runs and slaves are managed by a different master). And buildbot is at the center of it all. The load on our machine running buildbot is normally fairly high, and occasionally spikes so that the buildbot process is unresponsive. It normally restores itself within a few minutes, but I'd really like to know why it's doing this! Running our staging buildbot master with python's cProfile module for almost two hours yields the following profile:
   ncalls  tottime  percall  cumtime  percall filename:lineno(function)
   416377 4771.188    0.011 4796.749    0.012 {select.select}
       52  526.891   10.133  651.043   12.520 /tools/buildbot/lib/python2.5/site-packages/buildbot-0.7.10p1-py2.5.egg/buildbot/status/web/waterfall.py:834(phase2)
     6518  355.370    0.055  355.370    0.055 {posix.fsync}
   232582  238.943    0.001 1112.039    0.005 /tools/twisted-8.0.1/lib/python2.5/site-packages/twisted/spread/banana.py:150(dataReceived)
 10089681  104.395    0.000  130.089    0.000 /tools/twisted-8.0.1/lib/python2.5/site-packages/twisted/spread/banana.py:36(b1282int)
36798140/36797962   83.536    0.000   83.537    0.000 {len}
 29913653   70.458    0.000   70.458    0.000 {method 'append' of 'list' objects}
      311   63.775    0.205   63.775    0.205 {bz2.compress}
 10088987   56.581    0.000  665.982    0.000 /tools/twisted-8.0.1/lib/python2.5/site-packages/twisted/spread/banana.py:141(gotItem)
4010792/1014652   56.079    0.000  176.693    0.000 /tools/twisted-8.0.1/lib/python2.5/site-packages/twisted/spread/jelly.py:639(unjelly)

2343910/512709   47.954    0.000  112.446    0.000 /tools/twisted-8.0.1/lib/python2.5/site-packages/twisted/spread/banana.py:281(_encode)

Interpreting the results

select shows up in the profile because we're profiling wall clock time, not cpu time. So the more time we're spending in select, the better, since that means we're just waiting for data. The overall run time for this profile was 7,532 seconds, so select is taking around 63% of our total time. I believe the more time spent here, the better. Time spent inside select is idle time. We already knew that the buildbot waterfall was slow (the second line in profile). fsync isn't too surprising either. buildbot calls fsync after writing log files to disk. We've considered removing this call, and this profile lends support to our original guess. The next entries really surprised me, twisted's dataReceived and a decoding function, b1282int. These are called when processing data received from the slaves. If I'm reading this correctly, this means that dataReceived and children account for around 40% of our total time after you remove the time spent in select. 1112 / (7532-4796) = 40%. These results are from our staging buildbot master, which doesn't have anywhere near the same load as the production buildbot master. I would expect that the time spent waiting in select would go down on the production master (there's more data being received, more often), and that time spent in fsync and dataReceived would go up.

What to do about it?

A few ideas....
  • Use psyco to get some JIT goodness applied to some of the slower python functions.
  • Remove the fsync call after saving logs.
  • Use the cpu-time to profile rather than wallclock time. This will give a different perspective on the performance of buildbot, which should give better information about where we're spending time processing data.
  • Implement slow pieces in C (or cython). Twisted's Banana library looks do-able in C, and also is high up in the profile.
  • Send less data from the slaves. We're currently logging all stdout/stderr produced by the slaves. All of this data is processed by the master process and then saved to disk.
  • Rearchitect buildbot to handle this kind of load.
  • Have more than one buildbot master, each one handling fewer slaves. We're actively looking into this approach, since it also allows us to have some redundancy for this critical piece of our infrastructure.

poster 0.4 released

I'm happy to announce the release of poster version 0.4. This is a bug fix release, which fixes problems when trying to use poster over a secure connection (with https). I've also reworked some of the code so that it can hopefully work with python 2.4. It passes all the unit tests that I have under python 2.4 now, but since I don't normally use python 2.4, I'd be interested to hear other people's experience using it. One of the things that I love about working on poster, and about open source software in general, is hearing from users all over the world who have found it helpful in some way. It's always encouraging to hear about how poster is being used, so thank you to all who have e-mailed me! poster can be downloaded from my website, or from the cheeseshop. As always, bug reports, comments, and questions are always welcome.