Posts about work

Pull Diagnostic Support for Neovim

I've used vim as my primary text / code editing tool for...literally decades. A few years ago, I tried out neovim, hoping to take advantage of more advanced developer oriented features like treesitter and native LSP support.

At Shopify, I do a lot of work in Ruby. Our incredible developer experience team maintain ruby-lsp, a language server for the Ruby language.

Of course, I wanted to make sure that using it in neovim was a great experience!

LSPs can do many things: auto completion, enabling jumping to function or type definitions, showing function documentation, code formatting, and displaying code linting results.

In this particular instance, I wanted to take advantage of ruby-lsp's "diagnostics" support, which provides real-time feedback about syntax or linting errors (via rubocop)

For example:

brief aside: I find the nomenclature here is a bit awkward. LSP is an abbreviation for "Language Server Protocol". neovim implements a client which implements the LSP, which connects to one or more servers with also implement the protocol. Commonly a server which implements the LSP protocol is referred to as an "LSP server" or "LSP." I'll do that here.

Push vs pull

Unfortunately for me, neovim before 0.10 only supports "push" diagnostics, and ruby-lsp only supports "pull" diagnostics.

"Push" diagnostics are where the LSP pushes diagnostic information about your source code to the client (neovim in this case). The challenge with push diagnostics is that it's difficult for the LSP to know when to generate and send the diagnostics. It has no way to coordinate with other LSPs, and doesn't really how the user is interacting with the editor, aside from receiving events when the sourcecode has been changed. This becomes a problem when many changes to a file are made; how does the LSP know when to generate and push the diagnostics? Should it do it on every change? Wait for a bit after the last change is made?

These challenges are why the language server protocol was updated to add support for "pull" diagnostics. In this model the client (neovim) requests diagnostics from the LSP server, which is much more efficient since the client (neovim) can make much better decisions about when to perform sourcecode diagnostics.

more technically, "push" diagnostics are implemented via the textDocument/publishDiagnostics method. "pull" diagnostics are implemented via the textDocument/diagnostic method

Pull support in neovim (open-source FTW!)

Last year I spent some time adding support for pull diagnostics to neovim 0.10. I learned a lot about neovim, LSP, and lua in the process!

To me, this really highlights the benefits of open-source: there was something in my toolbox that I wasn't happy with, and I am empowered (and encouraged!) to contribute and make it better for everyone! Of course, I relied heavily on more experienced contributors to the project, and, of course, my initial implementation required some follow-ups.

My first neovim plugin

However, neovim 0.10 hasn't been released yet, and so I also wanted to make sure that I could use ruby-lsp with stable (0.9.x) versions of neovim.

So I created my very first neovim plugin: https://github.com/catlee/pull_diags.nvim. This enables "pull" diagnostics for neovim prior to 0.10. It's not quite as efficient as the support built into 0.10, but it works for my day to day development. If it doesn't work for you, please let me know!

Installing it is quite simple; for example, with Lazy.nvim:

{
  "catlee/pull_diags.nvim",
  event = "LspAttach",
  opts = {},
}

Final thoughts

As a professional software engineer, I think it's important to invest in the tools that I use to get my work done. Concretely, this means that I need (and want!) to spend time learning what new tools and techniques are out there now, and to make sure to sharpen my tools.

In this case, I wanted to take advantage of a new technology (LSP & ruby-lsp) in my editor of choice (neovim). Since these tools are all open-source, I'm empowered to change them to fit my needs.

In other words, as professionals, we shouldn't accept drawbacks or limitations in our tools: we should fix them! It's just another piece of software after all!

Layoffs & Survivor's Guilt

Shopify just laid off approximately 20% of its staff. A lot of fantastic people were let go.

(If you're hiring, let me know, I can put you in touch with some amazing engineers, managers, and designers!)

For those of us left behind, there's a bit of a sense of "what now?", "why wasn't I laid off too?", or "why did X get laid off instead of me (or Y)?""

One of Shopify's values is: "Thrive on Change". We famously cancelled a ton of meetings at the beginning this year.

I like to think of these events as shaking up my snow globe.

It's natural to develop a model of how our world works, and then to stop thinking about most things except the tasks at hand. We can't be re-evaluating everything from first principles all the time; models help us simplify so that we can be effective in day-to-day activities.

But sometimes our snow globe gets shaken up. Something happens that makes us re-examine some of out assumptions about our environment. Chaos Monkeys and layoffs are some events that shake up our snow globe.

If you've "survived" a layoff: you may be feeling guilty about still having a job. Survivor's guilt is real!

If you've been laid off: know that this says nothing about you as a person. You are still amazing, talented, and can make an incredible impact on the world.

I've been on both sides of this table throughout my career. There are almost never any simple answers to the "why?" questions.

All I know is that the best path forward isn't to wait first for the snow to settle. The snow never settles.

The best path forward is to enjoy a good snowfall.

self-serve builds!

Do you want to be able to cancel your own try server builds? Do you want to be able to re-trigger a failed nightly build before the RelEng sheriff wakes up? Do you want to be able to get additional test runs on your build? If you answered an enthusiastic YES to any or all of these questions, then self-serve is for you. self-serve was created to provide an API to allow developers to interact with our build infrastructure, with the goal being that others would then create tools against it. It's still early days for this self-serve API, so just a few caveats:

  • This is very much pre-alpha and may cause your computer to explode, your keg to run dry, or may simply hang.
  • It's slower than I want. I've spent a bit of time optimizing and caching, but I think it can be much better. Just look at shaver's bugzilla search to see what's possible for speed. Part of the problem here is that it's currently running on a VM that's doing a few dozen other things. We're working on getting faster hardware, but didn't want to block this pre-alpha-rollout on that.
  • You need to log in with your LDAP credentials to work with it.
  • The HTML interface is teh suck. Good thing I'm not paid to be a front-end webdev! Really, the goal here wasn't to create a fully functional web interface, but rather to provide a functional programmatic interface.
  • Changing build priorities may run afoul of bug 555664...haven't had a chance to test out exactly what happens right now if a high priority job gets merged with a lower priority one.
That being said, I'm proud to be able to finally make this public. Documentation for the REST API is available as part of the web interface itself, and the code is available as part of the buildapi repository on hg.mozilla.org https://build.mozilla.org/buildapi/self-serve Please be gentle! Any questions, problems or feedback can be left here, or filed in bugzilla.

Nightly build times getting slower over time

Yesterday some folks in #developers mentioned they felt their builds were getting slower over time. I wondered if the same was true for our build machines.

Here's a chart of build times for the past year. This is just the compile + link step for nightly builds, restricted to a single class of hardware per OS. Same machines. Slower builds. Something isn't right here. Windows builds have gone from an average of 90 minutes last March to 150 minutes this January. The big jump for OSX builds at the end of September is when we turned on the universal x86/x86_64 builds. There's a pretty clear upward trend; some of this is to be expected given new features being added, but at the same time more complexity is creeping into the Makefiles. Each little bit costs developers extra time every day doing their own builds, and it also means slower builds in the build infrastructure. Which means you'll wait longer to get try results, our build pools will have longer wait times, dogs and cats living together, and mass hysteria! I'm sure there are places in our build process that can be sped up. Think you can help? Are you a build system rock star? Do you refactor Makefiles in your sleep? Great! We're hiring!

Faster try builds!

When we run a try build, we wipe out the build directory between each job; we want to make sure that every user's build has a fresh environment to build in. Unfortunately this means that we also wipe out the clone of the try repo, and so we have to re-clone try every time. On Linux and OSX we were spending an average of 30 minutes to re-clone try, and on Windows 40 minutes. The majority of that is simply 'hg clone' time, but a good portion is due to locks: we need to limit how many simultaneous build slaves are cloning from try at once, otherwise the hg server blows up. Way back in September, Steve Fink suggested using hg's share extension to make cloning faster. Then in November, Ben Hearsum landed some changes that paved the way to actually turning this on. Today we've enabled the share extension for Linux (both 32 and 64-bit) and OSX 10.6 builds on try. Windows and OSX 10.5 are coming too, we need to upgrade hg on the build machines first. Average times for the 'clone' step are down to less than 5 minutes now. This means you get your builds 25 minutes faster! It also means we're not hammering the try repo so badly, and so hopefully won't have to reset it for a long long time. We're planning on rolling this out across the board, so nightly builds get faster, release builds get faster, clobber builds get faster, etc... Enjoy!

A year in RelEng

Something prompted me to look at the size of our codebase here in RelEng, and how much it changes over time. This is the code that drives all the build, test and release automation for Firefox, project branches, and Try, as well as configuration management for the various build and test machines that we have. Here are some simple stats: 2,193 changesets across 5 repositories...that's about 6 changes a day on average. We grew from 43,294 lines of code last year to 73,549 lines of code as of today. That's 70% more code today than we had last year. We added 88,154 lines to our code base, and removed 51,957. I'm not sure what this means, but it seems like a pretty high rate of change!

What do you want to know about builds?

Mozilla has been quite involved in recent buildbot development, in particular, helping to make it scale across multiple machines. More on this in another post! Once deployed, these changes will give us the ability to give real time access to various information about our build queue: the list of jobs waiting to start, and which jobs are in progress. This should help other tools like Tinderboxpushlog show more accurate information. One limitation of the upstream work so far is that it only captures a very coarse level of detail about builds: start/end time, and result code is pretty much it. No further detail about the build is captured, like which slave it executed on, what properties it generated (which could include useful information like the URL to the generated binaries), etc. We've also been exporting a json dump of our build status for many months now. It's been useful for some analysis, but it also has limitations: the data is always at least 5 minutes old by the time you look, and in-progress builds are not represented at all. We're starting to look at ways of exporting all this detail in a way that's useful to more people. You want to get notified when your try builds are done? You want to look at which test suites are taking the most time? You want to determine how our build times change over time? You want to find out what the last all-green revision was on trunk? We want to make this data available, so anybody can write these tools.

Just how big is that firehose?

I think we have one of the largest buildbot setups out there and we generate a non-trivial amount of data:
  • 6-10 buildbot master processes generating updates, on different machines in 2 or 3 data centers
  • around 130 jobs per hour composed of 4,773 individual steps total per hour. That works out to about 1.4 updates per second that are generated

How you can help

This is where you come in. I can think of two main classes of interfaces we could set up: a query-type interface where you poll for information that you are interested in, and a notification system where you register a listener for certain types (or all!) events. What would be the best way for us to make this data available to you? Some kind of REST API? A message or event brokering system? pubsubhubbub? Is there some type of data or filtering that would be super helpful to you?

Upcoming changes to unittests

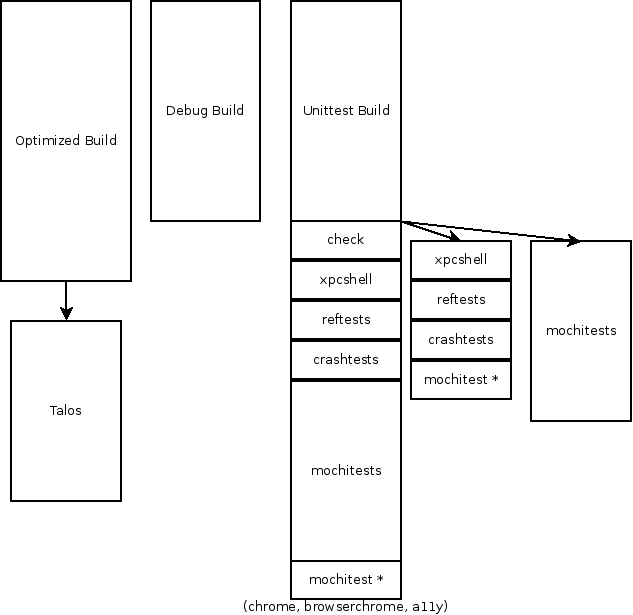
Since May, we've been running our unittest suite twice for each checkin: once for the current reference counting build + test job, and once for the packaged unittests. Current way of running tests Our end goal is to run unittests on our optimized and debug builds. We would stop doing our current reference counting builds, since the debug builds also have reference counting enabled. New way of running tests To get there requires a few intermediate steps:
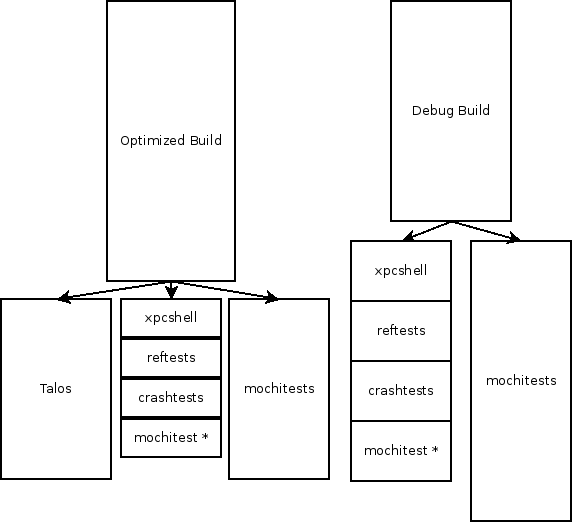
  • Turn off tests for the current build+tests unittest job. We're hoping to do this soon. The tests run on the packaged builds would still be active at this point (first phase of bug 507540).
  • Turn on tests for debug builds (bug 372581). There's a bit of work left to do here to make sure that hung processes don't kill the buildbot master with multi-gigabyte log files.
  • Turn on tests for optimized builds (bug 486783). This would include nightly and release builds eventually as well, and will give us test coverage on our windows PGO builds.
  • Turn off original reference counting builds completely, along with the tests done on these builds (second phase of bug 507540).
At some point we're also going to be changing how we run mochitests, by splitting the tests up according to which directory they're in, and then running each of the subset of tests in parallel on different machines (bug 452861).

Faster signing

Once upon a time, when Mozilla released a new version of Firefox, signing all of the .exes and .dlls for all of the locales took a few hours. As more locales were added, and the file sizes increased, this time has increased to over 8 hours to sign all the locales in a Firefox 3.5 release. This has been a huge bottleneck for getting new releases out the door. For our most recent Firefox releases, we've started using some new signing infrastructure that I've been working on over the past few months. There are quite a few reasons why the new infrastructure is faster:

  • Faster hardware. We've moved from an aging single core system to a new quad-core 2.5 GHz machine with 4 GB of RAM.
  • Concurrent signing of locales. Since we've got more cores on the system, we should take advantage of them! The new signing scripts spawn off 4 child processes, each one grabs one locale at a time to process.
  • In-process compression/decompression. Our complete.mar files use bz2 compression for every file in the archive. The old scripts would call the 'bzip2' and 'bunzip2' binaries to do compression and decompression. It's significantly faster to do these operations in-process.
  • Better caching of signed files. The biggest win came from the simple observation that after you sign a file, and re-compress it to include in a .mar file, you should be caching the compressed version to use later. The old scripts did cache signed files, but only the decompressed versions. So to sign the contents of our mar files, the contents would have to be completely unpacked and decompressed, then the cache was checked, files were signed or pulled from cache as necessary, and then re-compressed again. Now, we unpack the mar file, check the cache, and only decompress / sign / re-compress any files that need signing but aren't in the cache. We don't even bother decompressing files that don't need signing, another difference from the original scripts. Big thanks to Nick Thomas for having the idea for this at the Mozilla All-Hands in April.
As a result of all of this, signing all our locales can be done in less than 15 minutes now! See bug 470146 for the gory details. The main bottleneck at this point is the time it takes to transfer all of the files to the signing machine and back again. For a 3.5 release, there's around 3.5 GB of data to transfer back and forth, which takes on the order of 10 minutes to pull down to the signing machine, and another few minutes to push back after signing is done.

Profiling Buildbot

Buildbot is a critical part of our build infrastructure at Mozilla. We use it to manage builds on 5 different platforms (Linux, Mac, Windows, Maemo and Windows Mobile), and 5 different branches (mozilla-1.9.1, mozilla-central, TraceMonkey, Electrolysis, and Places). All in all we have 80 machines doing builds across 150 different build types (not counting Talos; all the Talos test runs and slaves are managed by a different master). And buildbot is at the center of it all. The load on our machine running buildbot is normally fairly high, and occasionally spikes so that the buildbot process is unresponsive. It normally restores itself within a few minutes, but I'd really like to know why it's doing this! Running our staging buildbot master with python's cProfile module for almost two hours yields the following profile:
   ncalls  tottime  percall  cumtime  percall filename:lineno(function)
   416377 4771.188    0.011 4796.749    0.012 {select.select}
       52  526.891   10.133  651.043   12.520 /tools/buildbot/lib/python2.5/site-packages/buildbot-0.7.10p1-py2.5.egg/buildbot/status/web/waterfall.py:834(phase2)
     6518  355.370    0.055  355.370    0.055 {posix.fsync}
   232582  238.943    0.001 1112.039    0.005 /tools/twisted-8.0.1/lib/python2.5/site-packages/twisted/spread/banana.py:150(dataReceived)
 10089681  104.395    0.000  130.089    0.000 /tools/twisted-8.0.1/lib/python2.5/site-packages/twisted/spread/banana.py:36(b1282int)
36798140/36797962   83.536    0.000   83.537    0.000 {len}
 29913653   70.458    0.000   70.458    0.000 {method 'append' of 'list' objects}
      311   63.775    0.205   63.775    0.205 {bz2.compress}
 10088987   56.581    0.000  665.982    0.000 /tools/twisted-8.0.1/lib/python2.5/site-packages/twisted/spread/banana.py:141(gotItem)
4010792/1014652   56.079    0.000  176.693    0.000 /tools/twisted-8.0.1/lib/python2.5/site-packages/twisted/spread/jelly.py:639(unjelly)

2343910/512709   47.954    0.000  112.446    0.000 /tools/twisted-8.0.1/lib/python2.5/site-packages/twisted/spread/banana.py:281(_encode)

Interpreting the results

select shows up in the profile because we're profiling wall clock time, not cpu time. So the more time we're spending in select, the better, since that means we're just waiting for data. The overall run time for this profile was 7,532 seconds, so select is taking around 63% of our total time. I believe the more time spent here, the better. Time spent inside select is idle time. We already knew that the buildbot waterfall was slow (the second line in profile). fsync isn't too surprising either. buildbot calls fsync after writing log files to disk. We've considered removing this call, and this profile lends support to our original guess. The next entries really surprised me, twisted's dataReceived and a decoding function, b1282int. These are called when processing data received from the slaves. If I'm reading this correctly, this means that dataReceived and children account for around 40% of our total time after you remove the time spent in select. 1112 / (7532-4796) = 40%. These results are from our staging buildbot master, which doesn't have anywhere near the same load as the production buildbot master. I would expect that the time spent waiting in select would go down on the production master (there's more data being received, more often), and that time spent in fsync and dataReceived would go up.

What to do about it?

A few ideas....
  • Use psyco to get some JIT goodness applied to some of the slower python functions.
  • Remove the fsync call after saving logs.
  • Use the cpu-time to profile rather than wallclock time. This will give a different perspective on the performance of buildbot, which should give better information about where we're spending time processing data.
  • Implement slow pieces in C (or cython). Twisted's Banana library looks do-able in C, and also is high up in the profile.
  • Send less data from the slaves. We're currently logging all stdout/stderr produced by the slaves. All of this data is processed by the master process and then saved to disk.
  • Rearchitect buildbot to handle this kind of load.
  • Have more than one buildbot master, each one handling fewer slaves. We're actively looking into this approach, since it also allows us to have some redundancy for this critical piece of our infrastructure.